Full-Stack Observability in Cozystack: Metrics, Logs and Traces
Setting up production observability for Kubernetes typically means: Prometheus (or VictoriaMetrics) for metrics, Loki (or similar) for logs, a tracing backend and OpenTelemetry Collector for distributed traces, Grafana for visualization, Alertmanager for alerts, exporters, RBAC to isolate tenants, retention policies, storage sizing… You’re looking at a week of YAML before you see your first dashboard. And multi-tenant isolation? That’s another week.
Cozystack ships a pre-configured monitoring stack (VictoriaMetrics, VictoriaLogs, Grafana, Fluent Bit, and Alerta) at both platform and tenant levels. Optional distributed tracing adds VictoriaTraces and a per-tenant OpenTelemetry Collector. Enable monitoring to get dashboards; configure tracing when your workloads need it. No need to assemble the observability infrastructure yourself.
At a glance
- Version: Cozystack v1.7 and later.
- Metrics: VictoriaMetrics Cluster per tenant, with 3-day short-term and 14-day long-term retention.
- Logs: VictoriaLogs per tenant, 1-month retention by default (configurable); Fluent Bit collects container logs, Kubernetes events, and audit logs.
- Traces: optional, off by default; VictoriaTraces storage with an OpenTelemetry Collector on OTLP/HTTP (
4318) and OTLP/gRPC (4317). - Dashboards: Grafana with pre-configured dashboards for each tenant’s managed services.
- Alerts: VMAlert and Alertmanager feed Alerta, which notifies via Telegram, Slack, or email.
- Isolation: each tenant sees only its own metrics, logs, traces, and alerts.
What you get out of the box
Platform level (system monitoring):
- VMAgent scraping Kubernetes API, kube-state-metrics, Node Exporter, and cAdvisor (30s intervals)
- Recording rules for aggregated metrics
- Alerting rules for node health, pod failures, and Kubernetes components
- Fluent Bit collecting container logs, Kubernetes events, and audit logs
Tenant level (per-tenant monitoring):
- VictoriaMetrics Cluster: dual-tier retention (3-day short-term and 14-day long-term)
- VictoriaLogs: 1-month log retention by default (configurable)
- Grafana: pre-configured dashboards for the managed services the tenant runs
- Alerta: alert aggregation with Telegram, Slack, or email notifications
- Optional distributed tracing: VictoriaTraces storage, an OpenTelemetry Collector, and a Grafana trace datasource; supports per-tenant or shared-central storage
Enable tenant monitoring
Via Dashboard: when creating or editing a tenant, enable the monitoring option.
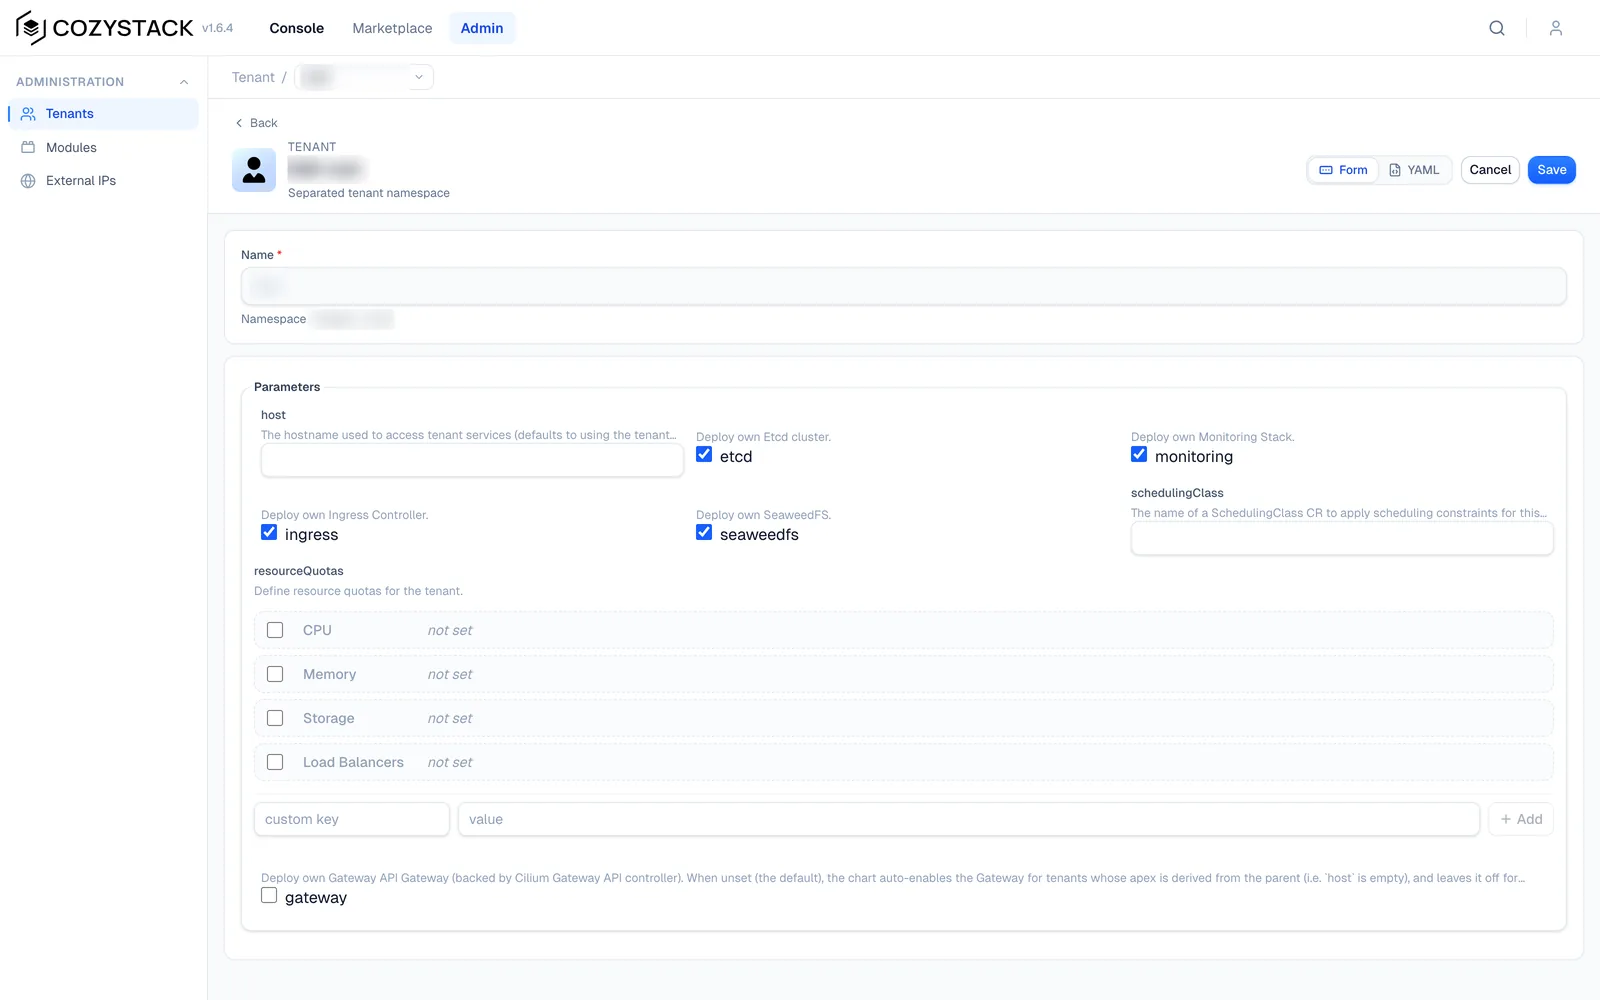
Via kubectl:
kubectl patch -n tenant-root tenants.apps.cozystack.io team1 \
  --type=merge -p '{"spec":{"monitoring":true}}'
After Flux reconciles the tenant’s monitoring application, Grafana becomes available at https://grafana.<tenant-host>.
Accessing dashboards
Open https://grafana.<tenant-host> in your browser.
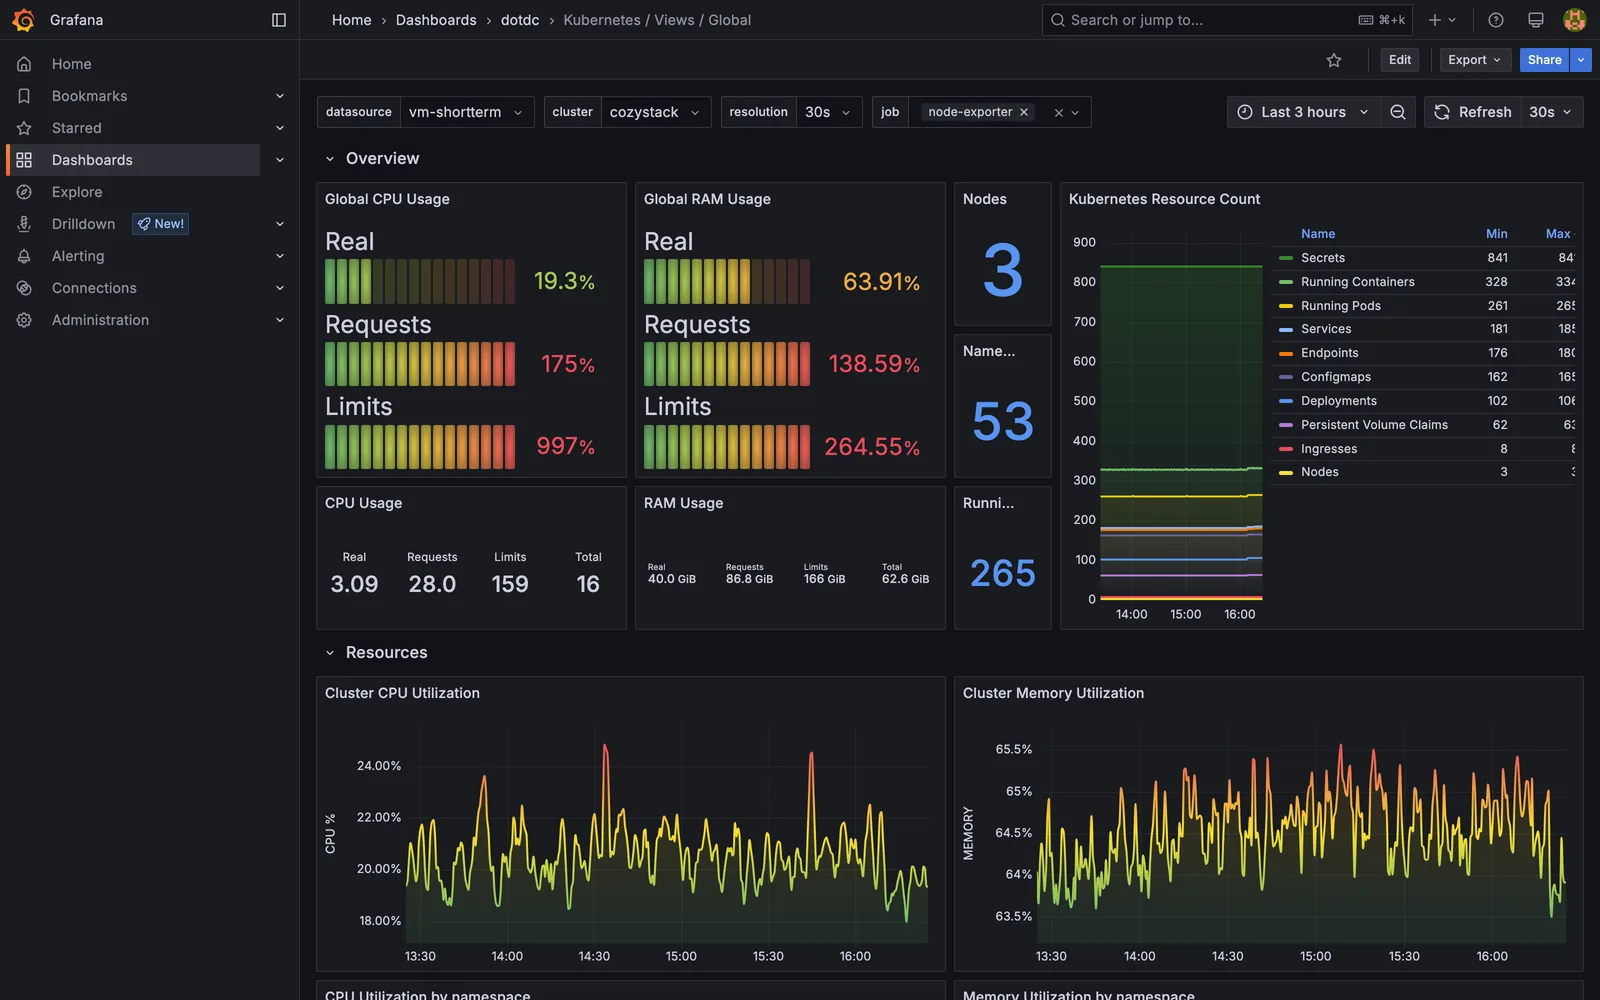
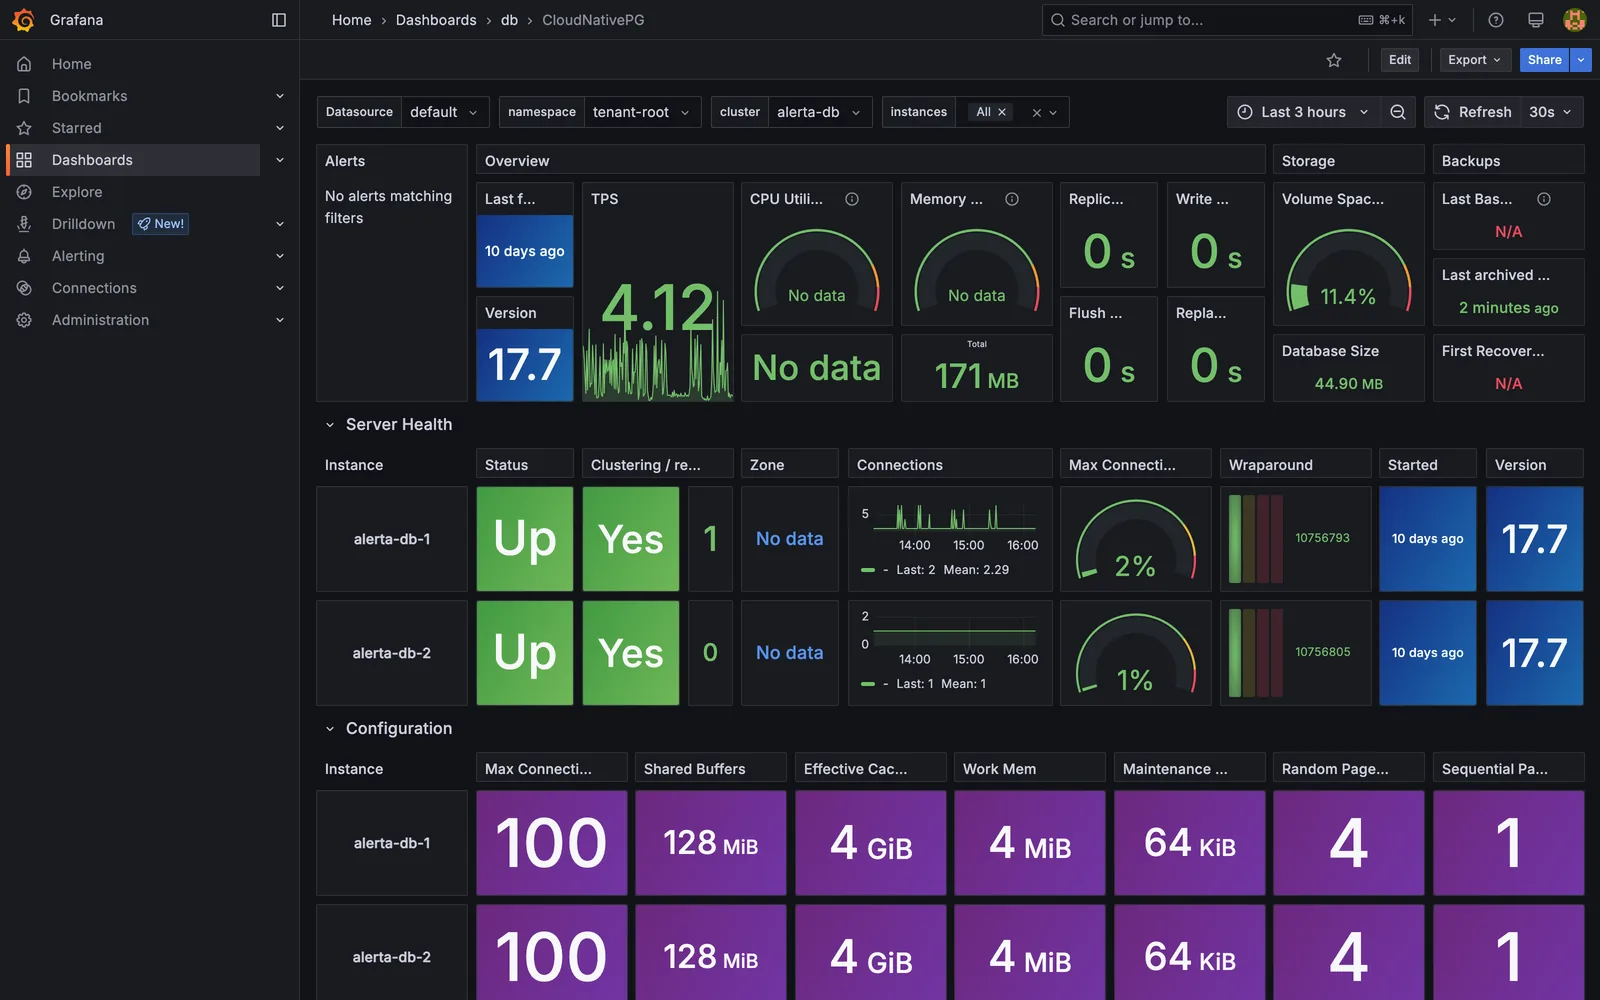
Every tenant’s Grafana includes dashboards for the managed services it runs:
- PostgreSQL (CloudNativePG), MySQL/MariaDB, and Redis performance
- Kafka, ClickHouse, NATS, and MongoDB
- Virtual machines and ingress traffic
The platform administrator’s Grafana in tenant-root additionally covers the cluster infrastructure:
- Kubernetes cluster overview and pod health
- Node resource utilization (CPU, memory, disk, network)
- etcd and Kubernetes control-plane metrics
- LINSTOR and SeaweedFS storage health
- Flux reconciliation and monitoring-stack metrics
Distributed tracing
Cozystack v1.7 supports distributed tracing alongside metrics and logs, bringing the three core observability signals into the platform. Tracing is optional and off by default: a tenant’s Monitoring application must be configured with a tracingStorages entry, or the tenant must opt into the shared-central tracing backend hosted by tenant-root (tracingCentral: true on the Tenant).
With tracing configured, Cozystack provides:
- OpenTelemetry ingestion: a per-tenant collector receives spans over OTLP/HTTP (
otel-traces:4318) or OTLP/gRPC (otel-traces:4317). - VictoriaTraces storage: run a local backend for the tenant, or use shared-central storage with tenant-isolated access.
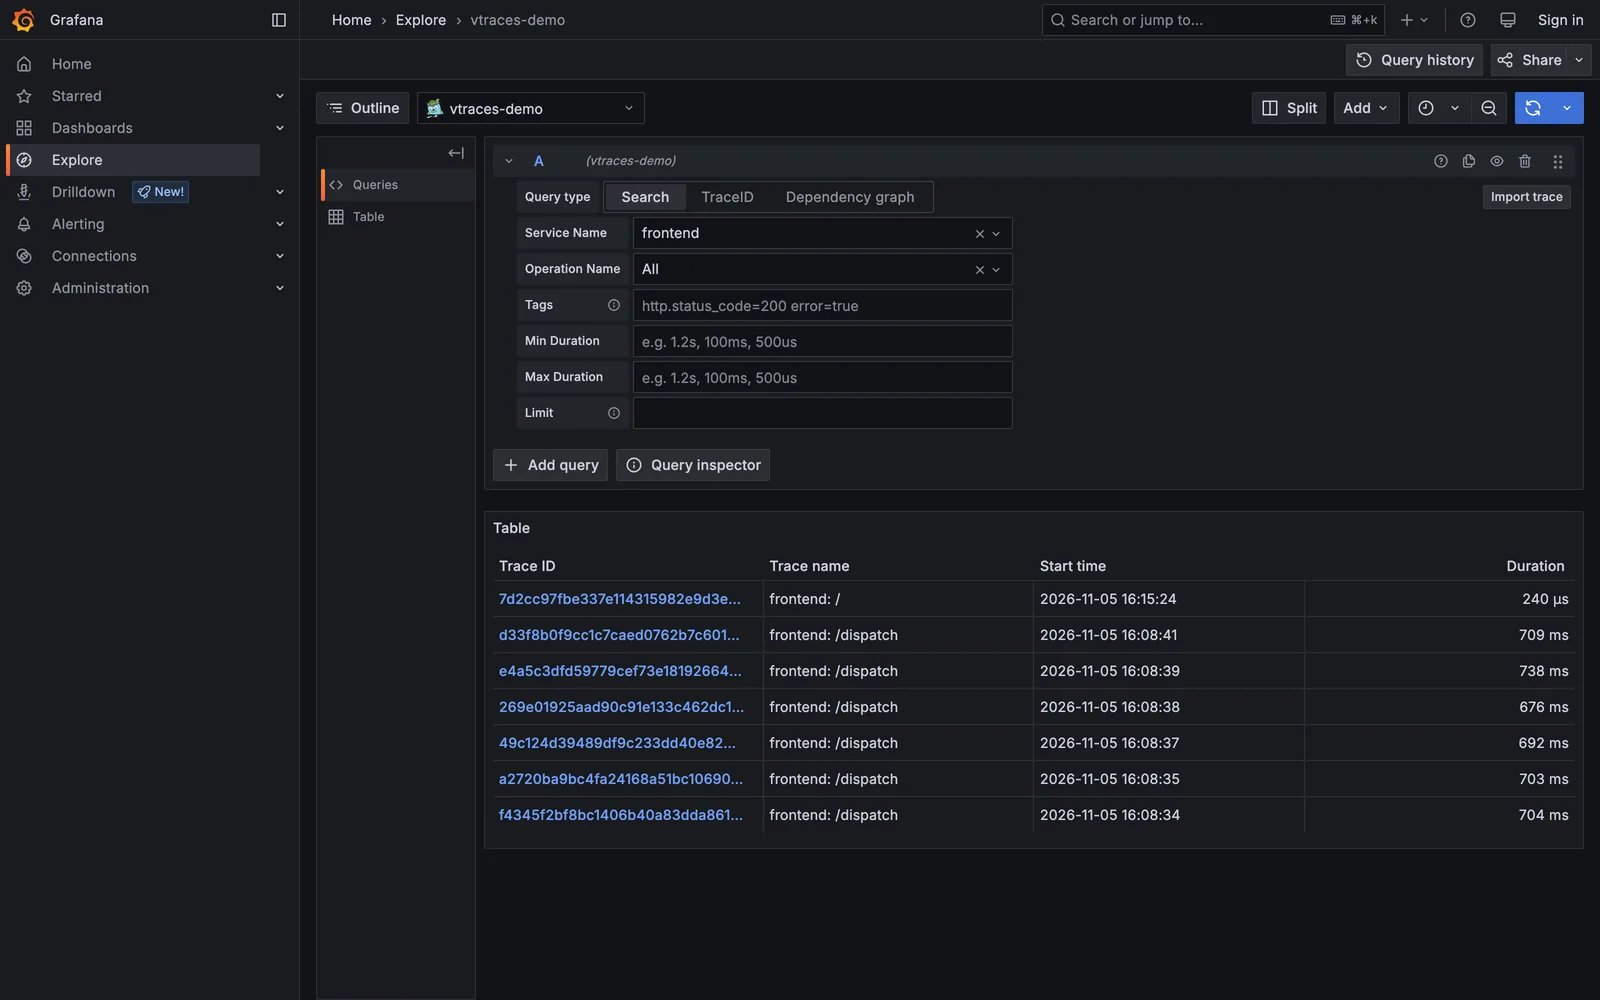
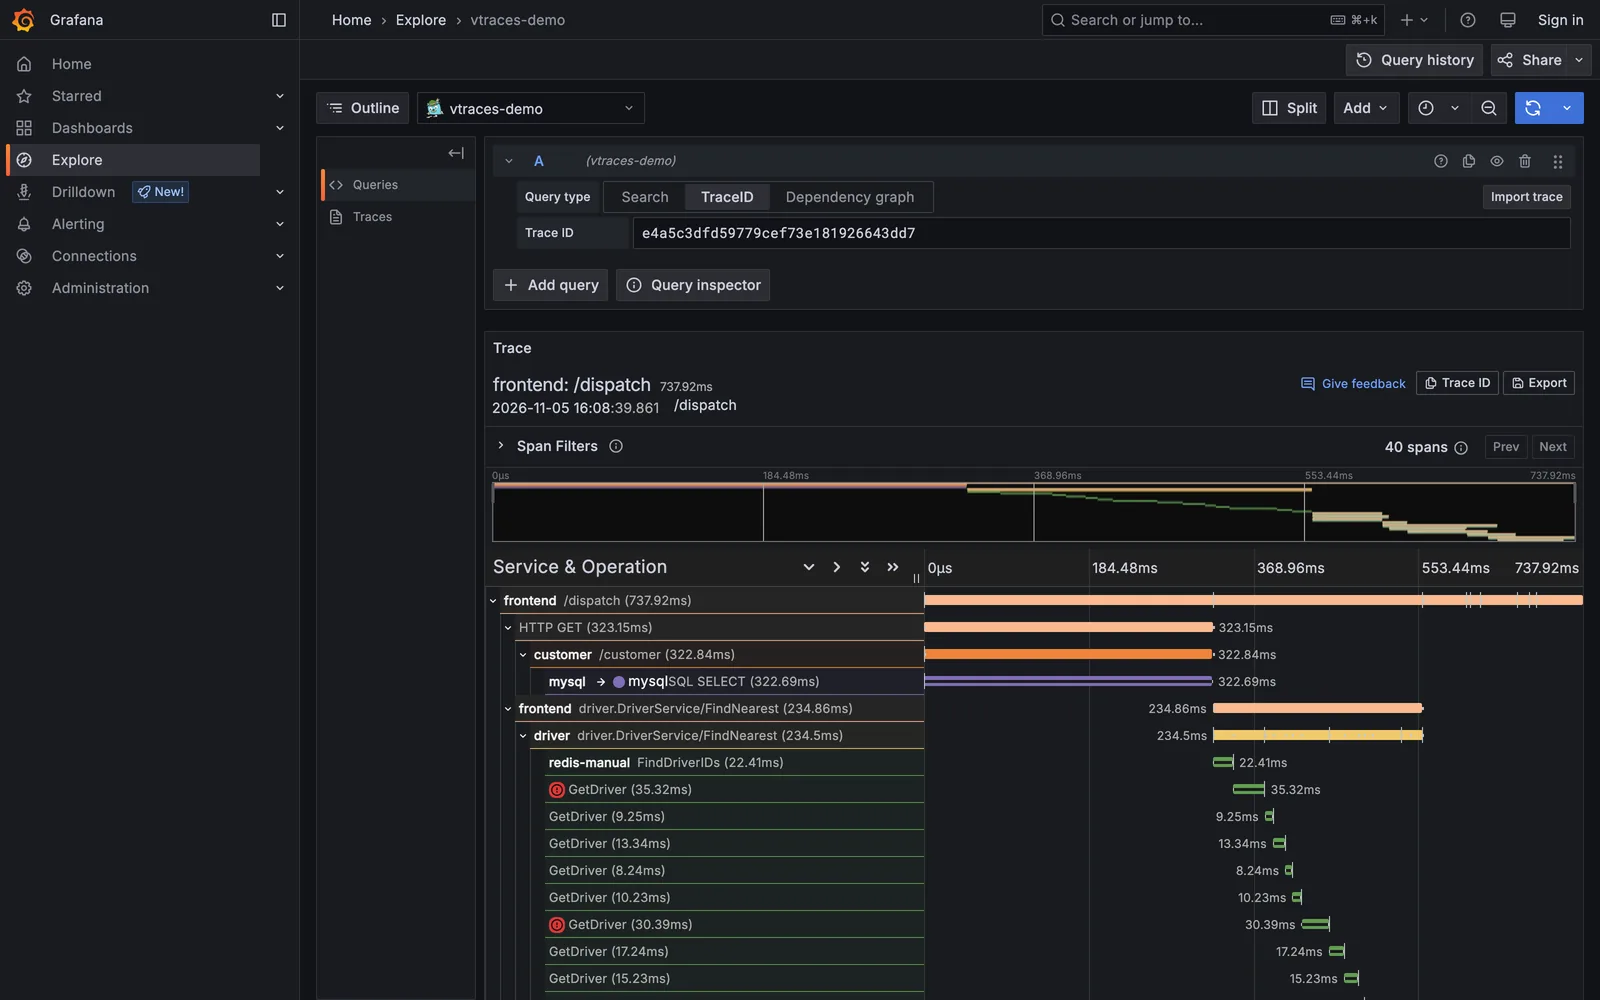
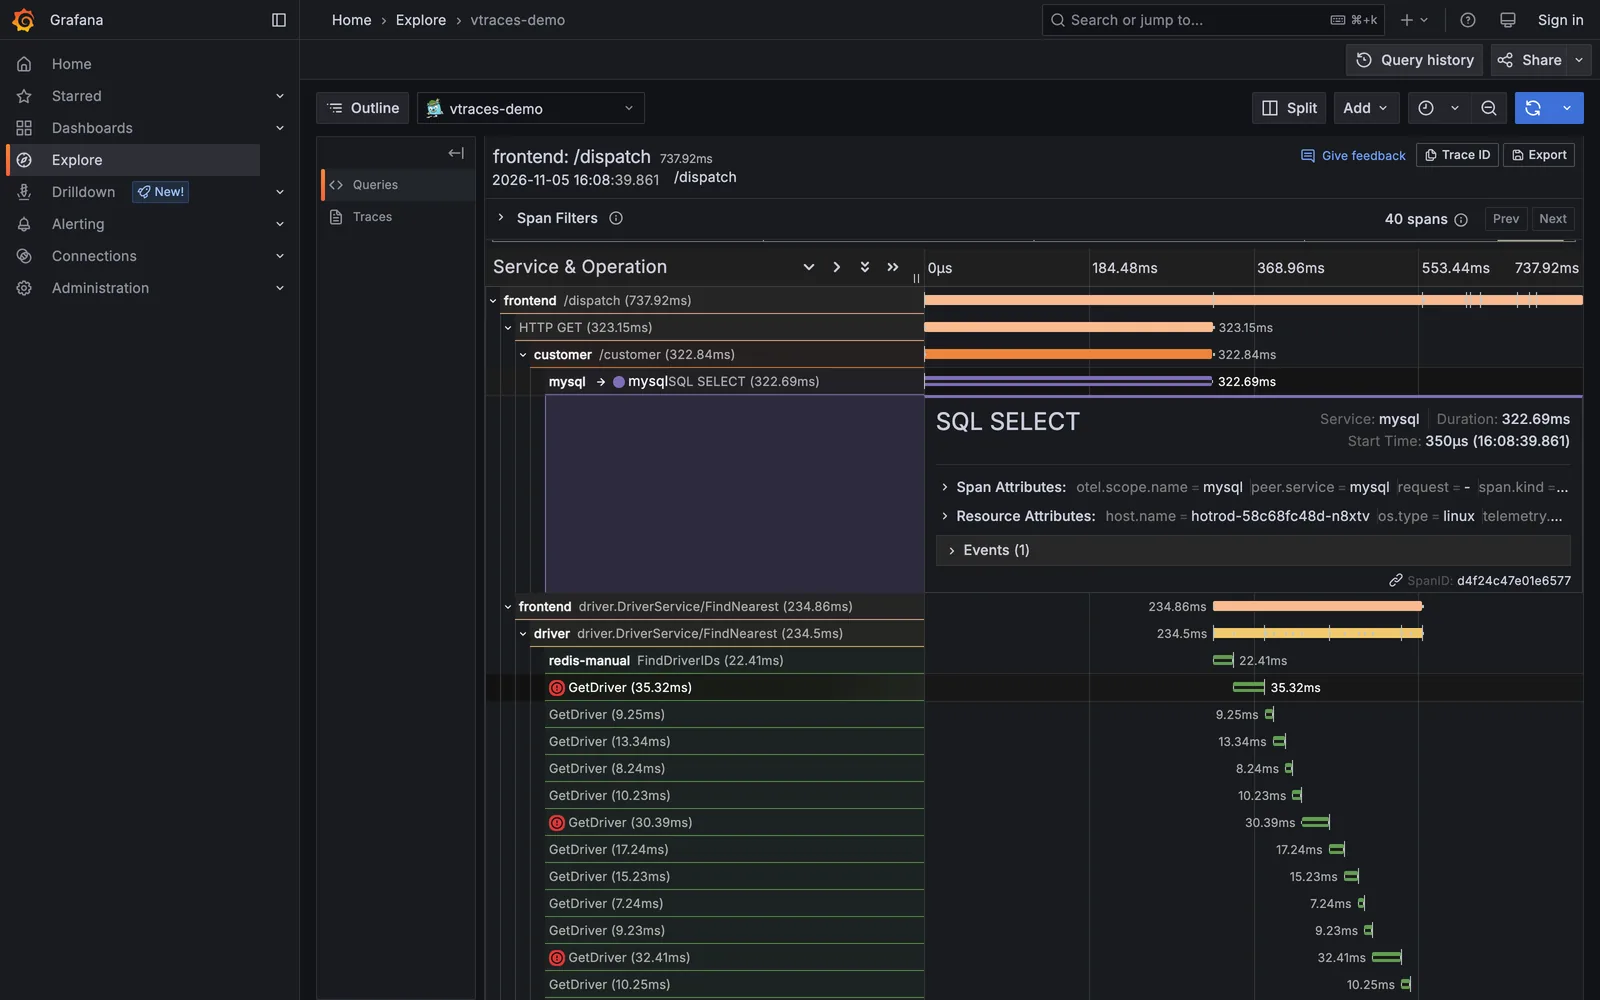
- Grafana integration: explore traces through a pre-configured Jaeger-compatible datasource in Grafana Explore.
- Sampling and redaction: the collector samples 10% of traces by default; administrators can adjust sampling and remove sensitive span attributes before export.
Getting started:
Configure a
tracingStoragesentry in the tenant’s Monitoring application, or settracingCentral: trueon the Tenant if the platform hosts shared-central tracing (tracingCentralHost: trueon the tenant-root Monitoring). The collector is enabled by default when tracing is configured.Instrument your application using an OpenTelemetry SDK or auto-instrumentation agent, then point it at the collector. For example, add these environment variables to the workload:
env:
  - name: OTEL_EXPORTER_OTLP_ENDPOINT
    value: "http://otel-traces:4318"
  - name: OTEL_EXPORTER_OTLP_PROTOCOL
    value: "http/protobuf"
  - name: OTEL_SERVICE_NAME
    value: "my-app"
Open Grafana Explore and select the traces datasource to view incoming spans.
OTLP/HTTP is the recommended protocol: with shared-central tracing, requests above the per-tenant write rate are retried over HTTP but dropped over gRPC.
Cozystack handles the collection pipeline, storage, and tenant-aware access, but applications must emit their own spans. Cross-signal navigation from traces to logs or metrics is not yet configured, so traces are currently explored separately.
Setting up alerts
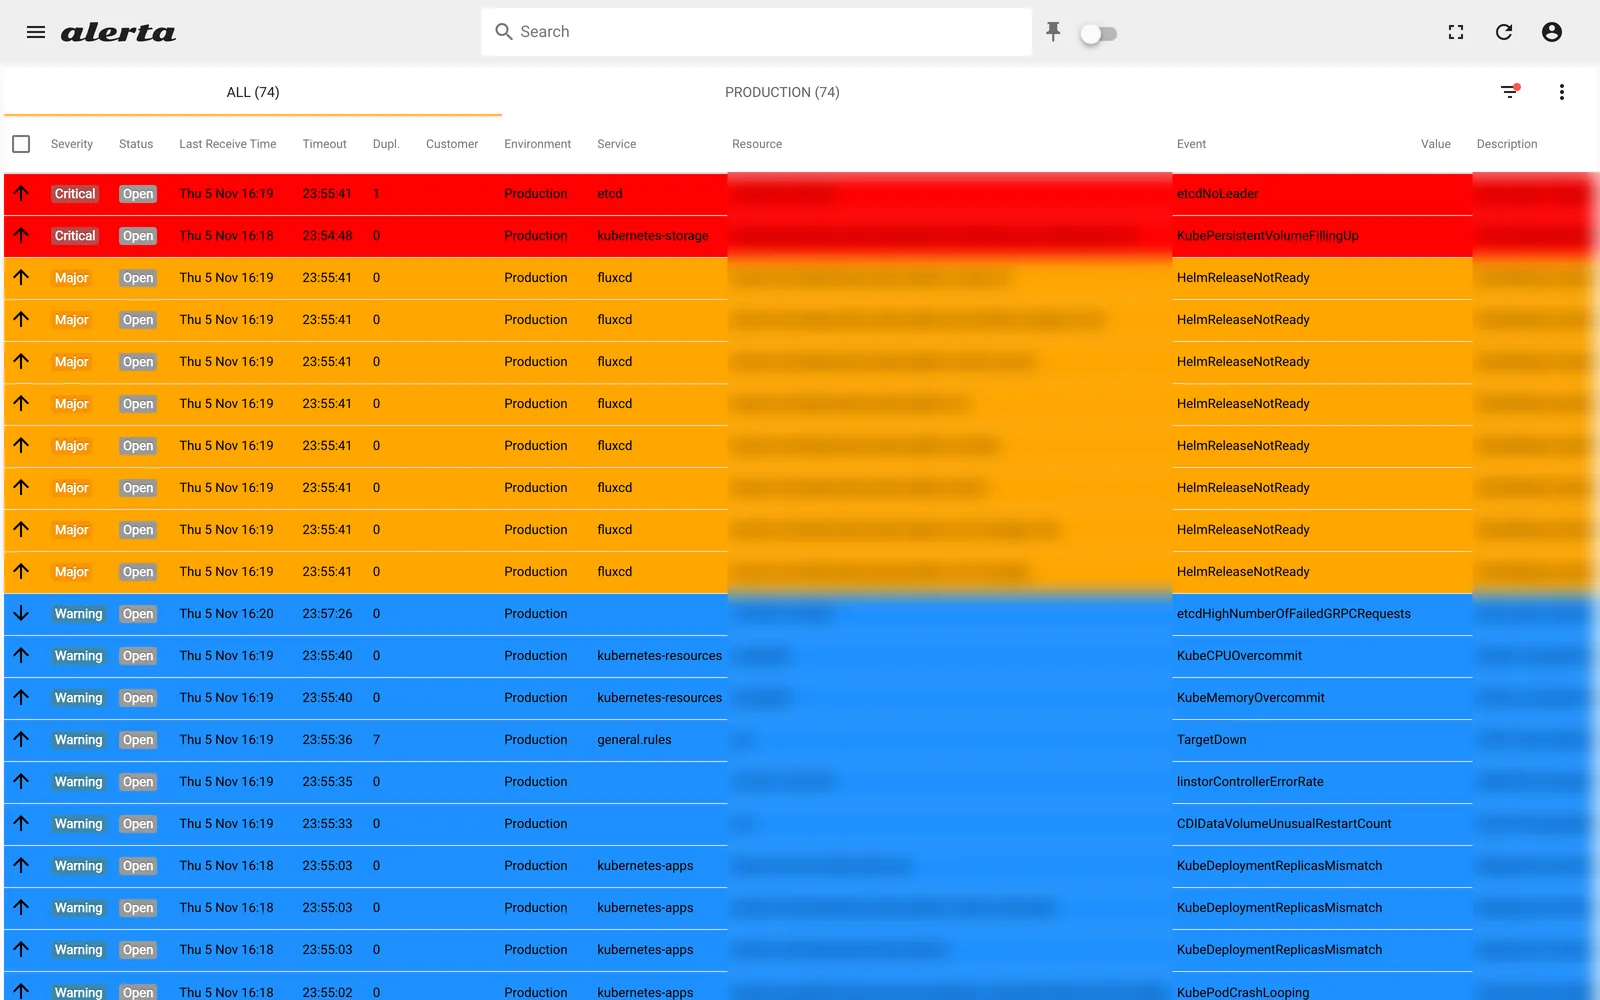
Alerta aggregates alerts and sends notifications. VMAlert evaluates the alerting rules and forwards firing alerts to Alertmanager, which routes them into Alerta for a single, deduplicated view. To configure Telegram:
- Open the tenant’s monitoring settings.
- Set the Telegram bot token and chat ID under
alerta.alerts.telegram.
Slack (alerta.alerts.slack) and email (alerta.alerts.email) are configured the same way.
Get notifications when monitoring rules detect unhealthy nodes, pods, or managed services, for example a failing pod or an unavailable metrics target.
Custom metrics
Add your own metrics by creating VMPodScrape or VMServiceScrape resources for applications exposing a Prometheus-compatible /metrics endpoint. The tenant-level VMAgent discovers eligible targets using the namespace.cozystack.io/monitoring namespace label.
Documentation
Cozystack is a free, open-source PaaS platform and a CNCF Sandbox project.
Join the community
- Cozystack on GitHub
- Telegram group
- Slack group (Get invite at https://slack.kubernetes.io)
- Community Meeting Calendar